Measuring bone density: detecting osteoporosis risk before fractures occur
Osteoporosis is known as a silent disease — bones thin without pain until a fracture delivers the first clear warning. A DXA bone density scan makes your bone status visible and shows whether action is needed.
How bone density declines over a lifetime
Bone is not static tissue — it is constantly being broken down and rebuilt. Most people reach their peak bone mass between the ages of 25 and 30. After that, a gradual loss begins. In women, this accelerates considerably around menopause, because oestrogen is important for maintaining bone. Within the first five to ten years after menopause, women can lose up to 20 percent of their bone density.
Men are less affected, but not immune: from age 70 onwards their bone density also declines noticeably. Osteoporosis — the disease caused by pathologically reduced bone density — is one of the most common conditions worldwide, yet it is widely underdiagnosed because it causes no symptoms until a fracture occurs.
How a DXA bone density scan works
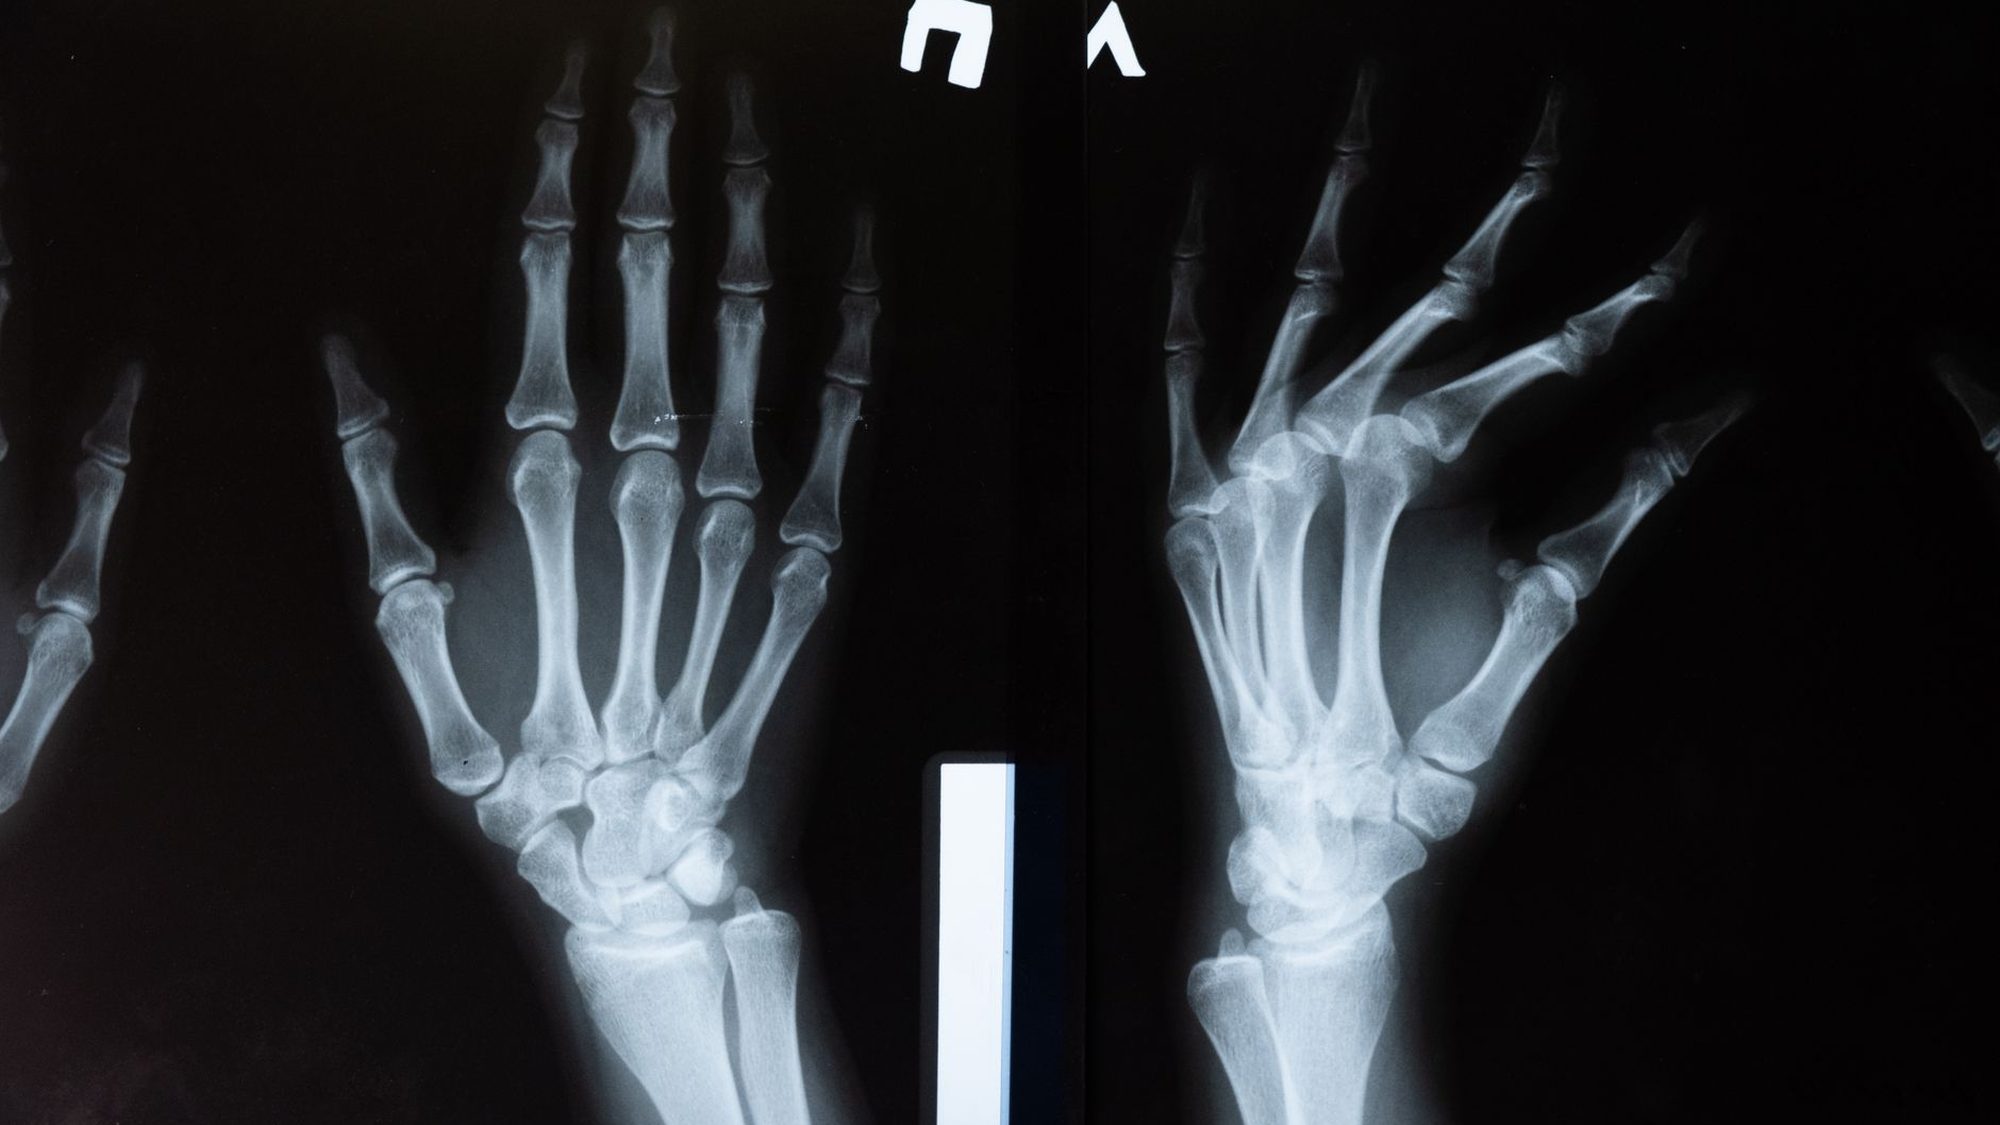
DXA (Dual-Energy X-ray Absorptiometry) is the standard method for measuring bone density. Two X-ray beams of different energies pass through the body; the device calculates the mineral density of the bone (BMD — Bone Mineral Density) in grams per square centimetre from the difference in their absorption. Measurements are typically taken at the lumbar spine (L1 to L4) and the hip (femoral neck and total hip).
The procedure involves low radiation — a DXA scan is roughly equivalent to the natural radiation exposure of a one-hour flight — and takes only a few minutes. Unlike a standard X-ray, which only shows changes when about 30 percent of bone mass has already been lost, DXA reliably detects earlier changes.
T-Score and Z-Score: How to read your result
The T-score is the core of a DXA report. It compares your bone density with the average of healthy young adults at peak bone mass. A T-score between −1.0 and −2.5 indicates reduced bone density (osteopenia); a value below −2.5 is classified as osteoporosis according to the World Health Organization's definition. The unit is the standard deviation (SD) from the reference value.
The Z-score, by contrast, compares you with your age group. It is particularly relevant for younger people and for assessing whether bone density is unusually low relative to peers — which can indicate secondary causes such as nutritional deficiencies, medications, or underlying conditions. Together, both values give a more complete picture than either one alone.
FRAX: Estimating your fracture risk over the next ten years
The World Health Organization's FRAX tool calculates the probability of sustaining an osteoporotic fracture in the next ten years. It combines the T-score with clinical risk factors: age, sex, height and weight, previous fractures, smoking status, alcohol consumption, family history, corticosteroid use, and the presence of certain medical conditions.
A T-score alone, without this clinical context, is an incomplete picture. Someone with a T-score of −2.0 and several additional risk factors has a significantly higher absolute fracture risk than someone with the same score and no risk factors. The FRAX calculator is freely accessible and serves as a basis for discussing next steps with your doctor.
When a measurement makes sense and which factors increase the risk
Guidelines generally recommend DXA scans for women from age 65 and men from age 70. Earlier scans may be appropriate if you: have been on long-term corticosteroid therapy (more than three months), experienced early menopause (before 45), have low body weight, a family history of osteoporosis, a previous low-trauma fracture, or conditions that affect bone metabolism.
According to current research, strength training has the strongest influence on bone metabolism in adults. Adequate calcium and vitamin D intake is a necessary prerequisite, but does not replace exercise. Smoking and high alcohol consumption are proven to harm bone health. This information helps to view measurements not just as a status report, but as a starting point for concrete action.
Documenting bone density values with the YUTHI app
In the YUTHI app, you can log your T-score, Z-score, and measurement date after each DXA scan. Since bone density changes slowly and scans are typically repeated every two to three years, the app helps you keep track of trends — and compare results directly at your next doctor's appointment.
That was the snapshot. The app turns it into daily support.
Measure every day instead of calculating once: Vito or Vita puts your numbers in context, builds you a weekly plan and speaks up when something stands out.
Launching at the end of 2026 — iPhone first, Android to follow. Let me know when it’s out ↓
Sources
- WHO Study Group. Assessment of Fracture Risk and its Application to Screening for Postmenopausal Osteoporosis. WHO Technical Report Series, 1994;843.
- Kanis JA et al. The diagnosis of osteoporosis. Journal of Bone and Mineral Research, 1994;9(8):1137–1141.
- Cummings SR, Melton LJ. Epidemiology and outcomes of osteoporotic fractures. Lancet, 2002;359(9319):1761–1767.
- Compston J et al. UK clinical guideline for the prevention and treatment of osteoporosis. Archives of Osteoporosis, 2017;12(1):43.